Map Oxbridge Applications, 58 Buckingham Gate, London, SW1E 6AJ

One of the most frequently asked questions we receive from Oxbridge applicants is “what are my chances of making a successful application to Oxford?”  

Our first response is always this: the answer varies depending on course choice, as well as your grades and personal strengths and weaknesses; there is no certain statistic that can tell you whether or not you will be accepted to a certain course or university.  

This being said, looking at the cold hard facts (i.e. admissions statistics) can be helpful when used as just one part of the decision-making process.  

In this article we have compiled the success rates for all undergraduate courses at Oxford University. We recommend looking through the metrics for the course(s) you are interested in and weighing them up alongside your personal reasons for/against each course.  

For more advice on how to use these statistics to your advantage, our expert consultants are available 9am-5pm every weekday to discuss your individual situation. Call them on +44 (0) 20 7499 2394 or email [email protected] 

Introduction to the Metrics

Introduction to the Metrics:

Applications is the number of applications made to the course.

Shortlisted is the number of people invited to interview.

Shortlisting Rate is the percentage of applicants who were shortlisted for interview.

Offers is the number of people given an offer for the course.

Offer Rate is the percentage of applicants who were given an offer.

Acceptances is the number of people who were accepted onto the course (i.e. who fulfilled the terms of their offer and formally accepted their place on the course).

Acceptance Rate is the percentage of applicants who fulfilled their offers and accepted their place.

Pre-Interview Admissions Test is an admissions test for which applicants must pre-register and sit prior to shortlisting for interview (other than STEP for Cambridge Mathematics, which is sat in the summer after application).

College Admissions Assessment is an admissions assessment sat by shortlisted applicants, usually just before or on the day of the interview, for which applicants do not need to pre-register.

Written Work refers to short- or medium-length samples of writing that applicants are required to submit as part of their application. Some courses require alternative forms of work to essays, such as musical notation or drawing portfolios.

A-Z of Courses

Course  Applications  Shortlisted  Shortlisting Rate  Offers  Offer Rate  Acceptances  Acceptance Rate  Pre-interview Admissions Test?  Written Work Typically Required? 
Archaeology and Anthropology   125  68  54%  25  20%  22  18%  No  Yes 
Asian and Middle Eastern Studies (AMES)  109  97  89%  46  42%  35  32%  No  Yes 
Biochemistry  875  366  42%  115  13%  100  11%  No  No 
Biology  742  343  46%  128  17%  109  15%  No  No 
Biomedical Sciences  490  117  24%  46  9%  41  8%  BMSAT (Biomedical Sciences Admissions Test)  No 
Chemistry  1015  658  65%  207  20%  175  17%  No  No 
Classical Archaeology and Ancient History (CAAH)  152  142  93%  32  21%  25  16%  AHCAAT (Ancient History and Classical Archaeology Admissions Test)  Yes 
Classics  313  302  96%  118  38%  100  32%  CAT (Classics Admissions Test)  Yes 
Classics and English  60  53  88%  15  25%  13  22%  CAT (Classics Admissions Test)  Yes 
Classics and Modern Languages  23  22  96%  10  43%  10  43%  CAT (Classics Admissions Test); MLAT (Modern Languages Admissions Test)  Yes 
Computer Science  866  155  18%  59  7%  52  6%  MAT (Mathematics Admissions Test)  No 
Computer Science and Philosophy  129  47  36%  15  12%  12  9%  MAT (Mathematics Admissions Test)  No 
Earth Sciences (Geology)  163  144  88%  42  26%  34  21%  No  No 
Economics and Management  1542  271  18%  91  6%  83  5%  TSA (Thinking Skills Assessment) Section 1  No 
Engineering Science  1031  417  40%  196  19%  163  16%  PAT (Physics Admissions Test)  No 
English Language and Literature  975  631  65%  249  26%  212  22%  No  Yes 
English and Modern Languages  91  80  88%  37  41%  35  38%  MLAT (Modern Languages Admissions Test)  Yes 
European and Middle Eastern Languages  40  35  88%  15  38%  13  33%  MLAT (Modern Languages Admissions Test)  Yes 
Fine Art  255  52  20%  31  12%  28  11%  No  Yes (Portfolio) 
Geography  339  247  73%  90  27%  70  21%  No  No 
History  958  664  69%  254  27%  214  22%  HAT (History Admissions Test)  Yes 
History (Ancient and Modern)  98  69  70%  23  23%  20  20%  HAT (History Admissions Test)  Yes 
History and Economics  158  61  39%  19  12%  18  11%  HAT (History Admissions Test); TSA (Thinking Skills Assessment) Section 1  Yes 
History and English  104  52  50%  13  13%  12  12%  HAT (History Admissions Test)  Yes 
History and Modern Languages  72  56  78%  19  26%  18  25%  HAT (History Admissions Test); MLAT (Modern Languages Admissions Test)  Yes 
History and Politics  381  142  37%  54  14%  48  13%  HAT (History Admissions Test)  Yes 
History of Art  107  49  46%  16  15%  14  13%  No  Yes 
Human Sciences  193  92  48%  32  17%  26  13%  TSA (Thinking Skills Assessment) Section 1  No 
Law   1858  606  33%  219  12%  192  10%  LNAT (Law National Admissions Test)  No 
Materials Science  148  112  76%  48  32%  44  30%  PAT (Physics Admissions Test)  No 
Mathematics  1807  544  30%  193  11%  179  10%  MAT (Mathematics Admissions Test)  No 
Mathematics and Computer Science  593  150  25%  65  11%  51  9%  MAT (Mathematics Admissions Test)  No 
Mathematics and Philosophy  163  62  38%  20  12%  19  12%  MAT (Mathematics Admissions Test)  No 
Mathematics and Statistics  142  23  16%  5  4%  3  2%  MAT (Mathematics Admissions Test)  No 
Medicine  1712  428  25%  162  9%  149  9%  UCAT (University Clinical Aptitude Test)  No 
Modern Languages  309  290  94%  171  55%  145  47%  MLAT (Modern Languages Admissions Test)  Yes 
Modern Languages and Linguistics  91  85  93%  41  45%  39  43%  MLAT (Modern Languages Admissions Test)  Yes 
Music  169  153  91%  91  54%  81  48%  No (Students will be asked to submit a video-recorded performance)  Yes 
Philosophy and Modern Languages  56  52  93%  24  43%  21  38%  MLAT (Modern Languages Admissions Test)  Yes 
Philosophy and Theology  146  58  40%  28  19%  25  17%  PhilAT (Philosophy Admissions Test)  Yes 
Philosophy, Politics and Economics (PPE)  1864  718  39%  265  14%  229  12%  TSA (Thinking Skills Assessment)  No 
Physics  1494  470  31%  190  13%  174  12%  PAT (Physics Admissions Test)  No 
Physics and Philosophy  139  28  20%  15  11%  12  9%  PAT (Physics Admissions Test)  No 
Psychology (Experimental)  379  139  37%  56  15%  43  11%  TSA (Thinking Skills Assessment) Section 1  No 
Psychology, Philosophy, and Linguistics (PPL)  275  99  36%  48  17%  38  14%  TSA (Thinking Skills Assessment) Section 1  No 
Religion and Asian and Middle Eastern Studies  3  1  33%  1  33%  1  33%  No  Yes 
Theology and Religion  116  85  73%  54  47%  46  40%  No  Yes 
Total  23211  9621  41%  3721  16%  3219  14%     

Oxford in Recent Years


Year of Application  Applicants  Offers  Offer Rate  Acceptances  Acceptance Rate  Trends 
2019  23,026  3,895  16.92%  3,286  14.27%   
2020  23,414  3,932  16.79%  3,695  15.78%  Relatively stable statistics across the board, with a 1.5% increase in acceptance rate despite increased applicants. 
2021  24,338  3,555  14.61%  3,298  13.55%  An increase in applicants paired with decreased offers and acceptances; resulted in noticeable decrease in both offer and acceptance rate.  
2022  23,819  3,645  15.30%  3,271  13.73%  Slight decrease in applicants, but relatively stable offer and acceptance rates. 
2023  23,211  3,721  16.03%  3,219  13.87%  A drop in applications paired with a slight increase in offers/offer rate, but little change in acceptance rate.  


Oxford’s application statistics in 2023 do very little to depart from the precedent of previous years. Offer rates continue their slight but steady increase since 2021, but this rate of increase is not matched by acceptance rates, which decreased by 2% in 2021 and have remained at a similar level since.  

Most Competitive Oxford Courses

By Shortlisting Rate

Subject  Shortlisting Rate  
Mathematics and Statistics  16% 
Computer Science  18% 
Economics and Management  18% 
Fine Art  20% 
Physics and Philosophy  20% 
Biomedical Sciences  24% 
Mathematics and Computer Science  25% 
Medicine  25% 
Mathematics  30% 
Physics  31% 
Average   41% 

By Offer Rate

Subject  Offer Rate  
Mathematics and Statistics  4% 
Economics and Management  6% 
Computer Science  7% 
Biomedical Sciences  9% 
Medicine  9% 
Physics and Philosophy  11% 
Mathematics and Computer Science  11% 
Mathematics  11% 
Fine Art  12% 
Law   12% 
Average  16% 

By Acceptance Rate

Subject  Acceptance Rate  
Mathematics and Statistics  2% 
Economics and Management  5% 
Computer Science  6% 
Biomedical Sciences  8% 
Medicine  9% 
Physics and Philosophy  9% 
Mathematics and Computer Science  9% 
Computer Science and Philosophy  9% 
Mathematics  10% 
Law   10% 
Average  14% 


The three tables above list the top ten most competitive courses at Oxford in terms of getting through to interviews, receiving an offer, and being accepted onto the course (i.e. meeting the terms of the offer and beginning the degree course).  

Mathematics and Statistics is the most competitive course across the board, with Computer Science and Economics and Management variously taking second and third places.  

Particularly when it comes to Computer Science and Economics, this is a common theme across UK university application statistics in recent years. Computer science is also the most competitive course at Cambridge University.  

One theme to notice is that there is consistency across the different figures, with three subjects appearing in the top ten for all three metrics (shortlisting rate, offer rate, and acceptance rate). This means that, generally speaking, the subjects for which shortlisting is more ruthless are also those which are more competitive when it comes to receiving an offer and being accepted onto the course.  

Another trend is that most of the top ten most competitive subjects are sciences. Of the twelve subjects featured across the tables, three are humanities, two are joint sciences with humanities, and the remaining seven are sciences.  

Least Competitive Oxford Courses

By Shortlisting Rate

Subject  Shortlisting Rate  
Classics  96% 
Classics and Modern Languages  96% 
Modern Languages  94% 
Classical Archaeology and Ancient History (CAAH)  93% 
Modern Languages and Linguistics  93% 
Philosophy and Modern Languages  93% 
Music  91% 
Asian and Middle Eastern Studies (AMES)  89% 
Earth Sciences (Geology)  88% 
English and Modern Languages  88% 
Average   41% 


By Offer Rate

Subject  Offer Rate  
Modern Languages  55% 
Music  54% 
Theology and Religion  47% 
Modern Languages and Linguistics  45% 
Classics and Modern Languages  43% 
Philosophy and Modern Languages  43% 
Asian and Middle Eastern Studies (AMES)  42% 
English and Modern Languages  41% 
Classics  38% 
European and Middle Eastern Languages  38% 
Average  16% 

By Acceptance Rate

Subject  Acceptance Rate  
Music  48% 
Modern Languages  47% 
Modern Languages and Linguistics  43% 
Classics and Modern Languages  43% 
Theology and Religion  40% 
Philosophy and Modern Languages  38% 
English and Modern Languages  38% 
European and Middle Eastern Languages  33% 
Religion and Asian and Middle Eastern Studies  33% 
Asian and Middle Eastern Studies (AMES)  32% 
Average  14% 


Again, there is a lot of consistency in the lists for each metric here, with seven of the subjects appearing in all three of the lists. In an opposite trend to the more competitive courses, almost all of the least competitive courses are arts and humanities subjects; only one science subject (Earth Sciences) appears in the lists, and only in terms of shortlisting rate rather than offer or acceptance rates.  

This tells us that, in general terms, humanities subjects appear to be less competitive than sciences at Oxford.  

The far higher shortlisting rates for the less competitive courses (almost all of which are humanities) also suggests that admissions tutors in arts and humanities departments tend to interview a far higher proportion of applicants. This could be because essay-based humanities courses tend to be more interpretive than hard sciences, making interviews a more decisive or useful element in evaluating the applicant’s potential.  

In terms of specific subjects, Modern Languages (and various of its joint courses) appear most consistently towards the top of all three lists, with Music performing highly in terms of Offer and Acceptance rates in particular.  

This is reflected in the Cambridge 2023 statistics, where Modern and Medieval Languages also topped the list for least competitive courses. Music, Theology, Classis, and AMES also appeared in the Cambridge top ten.  

Arts, Humanities, and Social Sciences Versus Sciences

Subject Category  Applications  % of Total Applications  Shortlisted  % of Total Shortlisted  Shortlisting Rate  Offers  % of Total Offers  Offer Rate  Acceptances  % of Total Acceptances  Acceptance Rate 
Arts, Humanities and Social Sciences  10,789  46.5%  5,240  54.5%  65%  2,099  56.4%  28%  1,807  56.1%  25% 
Joint Humanities and Sciences Courses  461  2%  167  1.7%  35%  62  1.7%  13%  50  1.6%  10% 
Sciences  11,620  50.1%  4,128  43%  40%  1,532  41.2%  15%  1,336  41.5%  13% 

Whilst Sciences narrowly make up the majority of applications to Oxford, Arts, Humanities, and Social Sciences take over when it comes to the number of Shortlisted, Offers, and Acceptances. Combination humanities/sciences degrees (encompassing only three courses: Human Sciences, Physics and Philosophy, and Computer Science and Philosophy) make up a very small percentage of all applicants, consistently measuring between 1.6 and 2 percent of the total for all metrics.  

The first big difference between the Humanities and the Sciences is the Shortlisting Rate – Arts, Humanities, and Social Sciences shortlist on average 65% of applicants, whilst the Sciences and combined degrees shortlist 40% and 35% respectively.  

The higher shortlisting percentage amongst humanities could be due to their being more discursive or essay-based topics, making interviews a more fruitful exercise for admissions tutors. It also suggests that perhaps other aspects, such as the admissions test, might be more valuable in the eyes of Science admissions tutors, thereby whitling down shortlisted applicants.  

The offer and acceptance rates for Arts, Humanities, and Social Sciences are also consistently just under twice as high as those for Science courses. This is a considerable difference. We see then that Humanities, Arts, and Social Sciences are across the board less competitive on average than Science courses.  

The three combination courses demonstrated in the table consist of only 461 applicants, so they should be taken with a grain of salt. However, we can see overwhelmingly that their statistics are at the low end of the spectrum, measuring below both Sciences and Humanities overall throughout.  

Do not, however, take this as a reflection necessarily on all joint honours courses, which we discuss in further detail below.  


Difference Between Offer Rate and Acceptance Rate


Why are offer rates and acceptance rates different? In short, offer rate refers to the percentage of applicants who receive an offer in the January, whilst acceptance rate refers to the percentage of applicants who are accepted onto the course in the summer (almost all of whom, barring exceptional circumstances, begin the course in October).   

What influences a student with an offer to not be eventually accepted? The prime reason for an applicant with an offer not to be accepted is that they have not fulfilled the terms of their offer. This usually means that they did not get sufficient grades in their A-level or equivalent exams.  

It also accounts for applicants who chose to pursue another course and withdrew their application between receiving their offer and attending university (although, this being the University of Oxford, this tends not to be very common).  

Let’s briefly explore the subjects with the largest differences between offer rate and acceptance rate (i.e. with the most applicants who received an offer but did not then begin the degree course). The ‘percentage of offers not accepted’ is the main metric we are using here; it indicates the percentage of applicants offered a place who were not then accepted onto the course. 

Subject  Offers  Acceptances  Percentage of offers not accepted 
Mathematics and Statistics  5  3  40.0% 
Asian and Middle Eastern Studies (AMES)  46  35  23.9% 
Psychology (Experimental)  56  43  23.2% 
Geography  90  70  22.2% 
Classical Archaeology and Ancient History (CAAH)  32  25  21.9% 
Mathematics and Computer Science  65  51  21.5% 
Psychology, Philosophy, and Linguistics (PPL)  48  38  20.8% 
Computer Science and Philosophy  15  12  20.0% 
Physics and Philosophy  15  12  20.0% 
Earth Sciences (Geology) 


42 


34 


19.0% 


Overall Totals  3721  3219  13.5% 

The first thing to point out is that the course topping the list, Mathematics and Statistics, only handed out a very small number of offers, so it is a little dangerous to extrapolate or draw too firm a conclusion about the result. We caution against heeding this too much since it is almost double the percentage of all the other courses in the top ten.  

What’s interesting is that there is a mix of sciences and humanities, including combination humanities/sciences courses, in the top ten list. This means we cannot reach a conclusive answer as to either Sciences or Humanities being ‘harder’ to fulfil the terms of the offer.  

One interesting observation is that of the courses we have labelled as combining humanities and sciences (Computer Science and Philosophy, Physics and Philosophy, Human Sciences, and Mathematics and Philosophy), three appear in the top ten, and another (Human Sciences) appears eleventh on the list.  

Whilst these are all courses giving a small number of offers, so we shouldn’t read too much into any one of them independently, taken together this may suggest that students for whom it is advantageous to take a combination of sciences and humanity degrees may find it trickier to fulfil their offers.  

Ultimately, these figures rely on individual applicants being able to fulfil the terms of their offers. So while we think it is useful to have a look at this metric for the course in which you are interested, we recommend focusing more on the grade requirements on the course webpage here and determining whether you personally could fulfil such an offer.  


Subject Size

Subjects with the Largest Number of Offers 

Subject  Applicants  Shortlisted  Shortlisting Rate  Offers  Offer Rate  Acceptances  Acceptance Rate 
Philosophy, Politics and Economics (PPE)  1864  718  39%  265  14%  229  12% 
History  958  664  69%  254  27%  214  22% 
English Language and Literature  975  631  65%  249  26%  212  22% 
Law   1858  606  33%  219  12%  192  10% 
Chemistry  1015  658  65%  207  20%  175  17% 
Engineering Science  1031  417  40%  196  19%  163  16% 
Mathematics  1807  544  30%  193  11%  179  10% 
Physics  1494  470  31%  190  13%  174  12% 
Modern Languages  309  290  94%  171  55%  145  47% 
Medicine  1712  428  25%  162  9%  149  9% 
Average       49%    20.6%    17.7% 


Subjects with the Smallest Number of Offers

Subject  Applicants  Shortlisted  Shortlisting Rate  Offers  Offer Rate  Acceptances  Acceptance Rate 
Religion and Asian and Middle Eastern Studies  3  1  33%  1  33%  1  33% 
Mathematics and Statistics  142  23  16%  5  4%  3  2% 
Classics and Modern Languages  23  22  96%  10  43%  10  43% 
History and English  104  52  50%  13  13%  12  12% 
Classics and English  60  53  88%  15  25%  13  22% 
European and Middle Eastern Languages  40  35  88%  15  38%  13  33% 
Physics and Philosophy  139  28  20%  15  11%  12  9% 
Computer Science and Philosophy  129  47  36%  15  12%  12  9% 
History of Art  107  49  46%  16  15%  14  13% 
History and Economics  158  61  39%  19  12%  18  11% 
Average       51%    21%    19% 


Here we have used number of offers as the key metric to determine the largest and smallest course, since it’s largely indicative of how many places are available on the course (although slightly inflated to account for people missing their offers).  

Looking at the averages at the bottom of both tables, we see that the numbers work out very similar for the largest and the smallest courses available at Oxford. This leads us to conclude that your chances of being shortlisted, receiving an offer, or being accepted onto any course at Oxford is impacted by the overall course size.  

Joint Versus Single Honours

One question we are asked a lot is whether applying for single or joint honours is a better strategy for Oxbridge acceptance. In this section, we have compared the joint subjects with their equivalent single-honours subjects (and collated averages across the board) to see if there are any notable differences.  

Each table below compares the joint courses for a certain subject, collates their averages, and then compares them with the single honours version of the subject.  


Classics Joint Courses

Subject  Applicants  Shortlisted  Shortlisting Rate  Offers  Offer Rate  Acceptances  Acceptance Rate 
Classics and English  60  53  88%  15  25%  13  22% 
Classics and Modern Languages  23  22  96%  10  43%  10  43% 
Average across joint courses      92% 


  34% 


  33% 


Classics   313  302  96%  118  38%  100  32% 


For Classics joint courses, there is a mixed bag of results. Shortlisting rates are relatively similar across the board. However, when it comes to Offer and Acceptance rates, Classics and Modern Languages are quite significantly less competitive than Classics single honours, whilst Classics and English is more competitive than Classics single honours.  


English and Joint Courses

Subject  Applicants  Shortlisted  Shortlisting Rate  Offers  Offer Rate  Acceptances  Acceptance Rate 
Classics and English  60  53  88%  15  25%  13  22% 
English and Modern Languages  91  80  88%  37  41%  35  38% 
History and English  104  52  50%  13  13%  12  12% 
Average across joint courses      75%    26% 


  24% 


English Language and Literature  975  631  65%  249  26%  212  22% 


English joint honours are similar, if not slightly less competitive, than English single honours, but the individual courses differ from one another. Joint degrees with Classics and Modern Languages have significantly higher shortlisting rates than History and English or the English single honours, but whilst the Offer and Acceptance rate for English and Modern Languages remains higher than the other courses, the Offer and Acceptance rate for Classics and English are similar to the single honours English course.  

History and English, despite being the most popular of the joint courses for applicants, gave out the fewest offers and therefore has a far lower offer and acceptance rate compared to all other English joint and single honours courses.  


History and Joint Courses

Subject  Applicants  Shortlisted  Shortlisting Rate  Offers  Offer Rate  Acceptances  Acceptance Rate 
History and Economics  158  61  39%  19  12%  18  11% 
History and English  104  52  50%  13  13%  12  12% 
History and Modern Languages  72  56  78%  19  26%  18  25% 
History and Politics  381  142  37%  54  14%  48  13% 
Average across joint courses      51% 


  16% 


  15% 


History  958  664  69%  254  27%  214  22% 


The average shortlisting, offer, and acceptance rates for the joint courses are lower than the history single honours courses, making them more competitive on average.  

This being said, one joint course actually has a higher shortlisting rate and acceptance rate compared with History single honours: History and Modern Languages. However, this higher shortlisting rate can be attributed to the admissions tutors’ need to assess language capacity, but the similar Offer and Acceptance rate compared to the single honours course means it isn’t any less competitive than History sole. However, it is still far and away the least competitive of the History joint honours courses.  

History and Economics and History and Politics are both significantly more competitive than History joint honours, so are worth considering seriously before selecting as the course for application.  


Maths Joint Courses

Subject  Applicants  Shortlisted  Shortlisting Rate  Offers  Offer Rate  Acceptances  Acceptance Rate 
Mathematics and Computer Science  593  150  25%  65  11%  51  9% 
Mathematics and Philosophy  163  62  38%  20  12%  19  12% 
Mathematics and Statistics  142  23  16%  5  4%  3  2% 
Average across joint courses      26% 


  9% 


  8% 


Mathematics  1807  544  30%  193  11%  179  10% 


There are two different stories when it comes to Maths joint courses. Although there are differences in shortlisting rates for interview, when it comes to offer and acceptance rates, Mathematics and Computer Science and Mathematics and Philosophy are roughly similar to the single honours Maths course.  

Mathematics and Statistics, however, is the most competitive course across all Oxford subjects last year, and therefore the offer and acceptance rates are far lower than the other single and joint honours courses.  

We can characterise Maths joint courses, then, as being generally no more or less competitive than Maths single honours, with Mathematics and Statistics as an anomaly and very highly competitive indeed.  


Modern Languages (European Languages) Joint Courses

Subject  Applicants  Shortlisted  Shortlisting Rate  Offers  Offer Rate  Acceptances  Acceptance Rate 
Classics and Modern Languages  23  22  96%  10  43%  10  43% 
English and Modern Languages  91  80  88%  37  41%  35  38% 
European and Middle Eastern Languages  40  35  88%  15  38%  13  33% 
History and Modern Languages  72  56  78%  19  26%  18  25% 
Modern Languages and Linguistics  91  85  93%  41  45%  39  43% 
Philosophy and Modern Languages  56  52  93%  24  43%  21  38% 
Average across joint courses      89% 


  39% 


  37% 


Modern Languages  309  290  94%  171  55%  145  47% 


Modern Languages and its joint courses demonstrate high figures across the board, making them very favourable options for applicants. The only general exception to this is History and Modern Languages, which sits below the rest of the joint and single honours courses. All joint courses, however, are more competitive than Modern Languages single honours (which is the least competitive course at Oxford in terms of offer rate).   

Overall, other than History and Modern Languages, combined language courses are more competitive across the board compared with Modern Languages single honours, but are all still very favourable compared to the overall average success rates.  


Philosophy Joint Courses

Subject  Applicants  Shortlisted  Shortlisting Rate  Offers  Offer Rate  Acceptances  Acceptance Rate 
Computer Science and Philosophy  129  47  36%  15  12%  12  9% 
Mathematics and Philosophy  163  62  38%  20  12%  19  12% 
Philosophy and Modern Languages  56  52  93%  24  43%  21  38% 
Philosophy and Theology  146  58  40%  28  19%  25  17% 
Physics and Philosophy  139  28  20%  15  11%  12  9% 
Average across all joint courses      45% 


  19% 


  17% 


Philosophy is an interesting case, since one cannot study Philosophy at Oxford as a single honours course (although it forms parts of both the PPE and PPL degree courses). Additionally, it is combined with both humanities and science subjects, meaning there is vast differences in the shortlisting, offer, and success rates.  

In general terms, Philosophy combination courses are more competitive when paired with competitive single-honours subjects (such as Computer Science or Physics), and less competitive when paired with less competitive single-honours subjects (such as Modern Languages).  

We recommend comparing your joint honours course with the specific single honours course in which you are interested to get a better picture.  


Theology/Religion Joint Courses

Subject  Applicants  Shortlisted  Shortlisting Rate  Offers  Offer Rate  Acceptances  Acceptance Rate 
Philosophy and Theology  146  58  40%  28  19%  25  17% 
Religion and Asian and Middle Eastern Studies  3  1  33%  1  33%  1  33% 
Average across joint courses      37% 


  26% 


  25% 


Theology and Religion  116  85  73%  54  47%  46  40% 


Theology joint honours courses are more competitive than the Theology and Religion degree, with significantly lower shortlisting rates across the board and big differences in offer and acceptance rates. Philosophy and Theology is the far more competitive subject here, although Religion and Asian and Middle Eastern Studies only received three applications, so it is difficult to draw conclusions from this set of results.  


Asian and Middle Eastern Languages Joint Courses  

Subject  Applicants  Shortlisted  Shortlisting Rate  Offers  Offer Rate  Acceptances  Acceptance Rate 
European and Middle Eastern Languages  40  35  88%  15  38%  13  33% 
Religion and Asian and Middle Eastern Studies  3  1  33%  1  33%  1  33% 
Average across joint courses      61% 


  36% 


  33% 


Asian and Middle Eastern Studies (AMES)  109  97  89%  46  42%  35  32% 


In general, combining another course with Asian or Middle Eastern Studies does not impact success rates significantly at all. Again, Religion and Asian and Middle Eastern Studies is a very small applicant pool, so we would caution against drawing too solid a conclusion from the results there.  


Overall Trends

In general terms, combination courses are smaller than the single honours, and can be more demanding in terms of their offer requirements. The results above demonstrate how we are unable to make a single rule about joint honours courses being more competitive than their single honours equivalent.  

In many cases, the joint course success rates are remarkably similar, if not slightly more favourable, than the single honours course, whereas for others, they are a lot more difficult to get into. We therefore recommend applicants check the specific courses before deciding whether to apply to joint honours, rather than avoiding it on principle.  

One theme we can point out is that combination courses where each element is a single honours course in its own right tend to have rates between the two single honours equivalents.  

We see this most strongly in Modern Languages joint honours courses, where each are more competitive than Modern Languages single honours, but similarly or less competitive than the single honours equivalent of the other side of the course. For example, where Modern Languages has an acceptance rate of 47% and Classics an acceptance rate of 32%, Classics and Modern Languages joint honours has an acceptance rate of 43%.  

Therefore, if you are coming from a Modern Languages background and considering adding Classics, then you are lowering your chances, but if you are a Classics applicant considering an additional Modern Language, then you are upping your chances by going for the joint honours course.  

In short, for applicants considering adding Modern Languages to their degree course, check the statistic as it might be a great option for increasing your chances of a successful application! 

Do Admissions Tests Have an Impact on the Figures?

Another question we are frequently asked is to what extent sitting an admissions test may or may not impact an applicant’s chances. In the tables below we have split the subjects into those with and without admissions tests to compare their average rates.  

Do note that for courses with a new test this year (CAAH and Biomedical Sciences), we have left them out since last year’s applicants did not sit any admissions test. 


Courses with Admissions Tests

Subject  Shortlisting Rate  Offer Rate  Acceptance Rate  Admissions Test 
Classics and English  88%  25%  22%  CAT (Classics Admissions Test) 
Classics  96%  38%  32%  CAT (Classics Admissions Test) 
Classics and Modern Languages  96%  43%  43%  CAT (Classics Admissions Test); MLAT (Modern Languages Admissions Test) 
History and English  50%  13%  12%  HAT (History Admissions Test) 
History and Politics  37%  14%  13%  HAT (History Admissions Test) 
History  69%  27%  22%  HAT (History Admissions Test) 
History (Ancient and Modern)  70%  23%  20%  HAT (History Admissions Test) 
History and Modern Languages  78%  26%  25%  HAT (History Admissions Test); MLAT (Modern Languages Admissions Test) 
History and Economics  39%  12%  11%  HAT (History Admissions Test); TSA (Thinking Skills Assessment) Section 1 
Law   33%  12%  10%  LNAT (Law National Admissions Test) 
Computer Science and Philosophy  36%  12%  9%  MAT (Mathematics Admissions Test) 
Mathematics and Computer Science  25%  11%  9%  MAT (Mathematics Admissions Test) 
Mathematics and Philosophy  38%  12%  12%  MAT (Mathematics Admissions Test) 
Mathematics and Statistics  16%  4%  2%  MAT (Mathematics Admissions Test) 
Computer Science  18%  7%  6%  MAT (Mathematics Admissions Test) 
Mathematics  30%  11%  10%  MAT (Mathematics Admissions Test) 
English and Modern Languages  88%  41%  38%  MLAT (Modern Languages Admissions Test) 
European and Middle Eastern Languages  88%  38%  33%  MLAT (Modern Languages Admissions Test) 
Modern Languages and Linguistics  93%  45%  43%  MLAT (Modern Languages Admissions Test) 
Philosophy and Modern Languages  93%  43%  38%  MLAT (Modern Languages Admissions Test) 
Modern Languages  94%  55%  47%  MLAT (Modern Languages Admissions Test) 
Physics and Philosophy  20%  11%  9%  PAT (Physics Admissions Test) 
Engineering Science  40%  19%  16%  PAT (Physics Admissions Test) 
Materials Science  76%  32%  30%  PAT (Physics Admissions Test) 
Physics  31%  13%  12%  PAT (Physics Admissions Test) 
Philosophy and Theology  40%  19%  17%  PhilAT (Philosophy Admissions Test) 
Philosophy, Politics and Economics (PPE)  39%  14%  12%  TSA (Thinking Skills Assessment) 
Economics and Management  18%  6%  5%  TSA (Thinking Skills Assessment) Section 1 
Human Sciences  48%  17%  13%  TSA (Thinking Skills Assessment) Section 1 
Psychology (Experimental)  37%  15%  11%  TSA (Thinking Skills Assessment) Section 1 
Psychology, Philosophy, and Linguistics (PPL)  36%  17%  14%  TSA (Thinking Skills Assessment) Section 1 
Medicine  25%  9%  9%  UCAT (University Clinical Aptitude Test) 
Average   53%  21%  19%   


Courses without Admissions Tests

Subject  Shortlisting Rate  Offer Rate  Acceptance Rate  Admissions Test 
Religion and Asian and Middle Eastern Studies  33%  33%  33%  No 
Archaeology and Anthropology   54%  20%  18%  No 
Asian and Middle Eastern Studies (AMES)  89%  42%  32%  No 
Biochemistry  42%  13%  11%  No 
Biology  46%  17%  15%  No 
Chemistry  65%  20%  17%  No 
Earth Sciences (Geology)  88%  26%  21%  No 
English Language and Literature  65%  26%  22%  No 
Fine Art  20%  12%  11%  No 
Geography  73%  27%  21%  No 
History of Art  46%  15%  13%  No 
Theology and Religion  73%  47%  40%  No 
Music  91%  54%  48%  No (Students will be asked to submit a video-recorded performance) 
Averages  58%  25%  21%   


The tables above give us one key finding: Admissions Tests at Oxford do not impact the shortlisting, offer, or acceptance rate in any discernible way. This makes sense since at Oxford Admissions Tests are used across most of the courses, not just the most competitive ones, meaning there is no defining factor that means a course is either given or not given an admissions test.  

Additionally, most course groups at Oxford have the same admissions test, meaning chances are you won’t have the chance to choose between courses within your field of interest based on their having or not having an admissions test.  

One of the most frequently asked questions we receive from potential university applicants is “what are my chances of making a successful application to Cambridge?”  

Our first response is always this: the answer varies depending on course choice, as well as your grades and personal strengths and weaknesses; there is no certain statistic that can tell you whether or not you will be accepted to a certain course or university.  

This being said, looking at the cold hard facts (i.e. admissions statistics) can be helpful when used as just one part of the decision-making process.  

In this article we have compiled the success rates for all undergraduate courses at Cambridge University. We recommend looking through the metrics for the course(s) you are interested in and weighing them up alongside your personal reasons for/against each course.  

For more advice on how to use these statistics to your advantage, our expert consultants are available 9am-5pm every weekday to discuss your individual situation. Call them on +44 (0) 20 7499 2394 or email [email protected] 

Introduction to the Metrics

Introduction to the Metrics:

Applications is the number of applications made to the course.

Offers is the number of people given an offer for the course.

Offer Rate is the percentage of applicants who were given an offer.

Acceptances is the number of people who were accepted onto the course (i.e. who fulfilled the terms of their offer and formally accepted their place on the course).

Acceptance Rate is the percentage of applicants who fulfilled their offers and accepted their place.

Pre-Interview Admissions Test is an admissions test for which applicants must pre-register and sit prior to shortlisting for interview (other than STEP for Cambridge Mathematics, which is sat in the summer after application).

College Admissions Assessment is an admissions assessment sat by shortlisted applicants, usually just before or on the day of the interview, for which applicants do not need to pre-register.

Written Work refers to short- or medium-length samples of writing that applicants are required to submit as part of their application. Some courses require alternative forms of work to essays, such as musical notation or drawing portfolios.

A-Z of Courses

Course  Applications  Offers  Offer Rate  Acceptances  Acceptance Rate  Pre-interview Admissions Test?  College Admissions Assessment (usually At-Interview)  Written Work Typically Required? 
Anglo-Saxon, Norse, and Celtic (ASNC) 62  36  58.1%  19  30.6%  No  No  Yes 
Archaeology  82  46  56.1%  32  39%  No  Yes (All Colleges)  Yes 
Architecture  522  96  18.4%  60  11.5%  No  Yes (All Colleges)  Yes (Portfolio submission) 
Asian and Middle Eastern Studies (AMES)  124  51  41.1%  40  32.2%  No  Yes (King’s and St Edmund’s Colleges)  No 
Chemical Engineering and Biotechnology  373  88  23.6%  67  18%  ESAT (Engineering and Science Admissions Test)  No  No 
Classics  126  59  46.8%  50  39.7%  No  Yes (All Colleges)  Yes 
Computer Science  1583  147  9.3%  121  7.6%  TMUA (Test of Mathematics for University Admissions)  Yes (Peterhouse and Trinity Colleges: Computer Sciences Aptitude Test)  No 
Economics  1336  183  13.7%  162  12.1%  TMUA (Test of Mathematics for University Admissions)  No  No 
Education  190  50  26.3%  34  17.9%  No  No  Yes 
Engineering  2410  370  15.4%  333  13.8%  ESAT (Engineering and Science Admissions Test)  No  No 
English  756  222  29.4%  187  24.7%  No  Yes (All Colleges)  Yes 
Geography  524  138  26.3%  99  18.9%  No  Yes (Hughes Hall and St Edmund’s Colleges)  No 
History and Modern Languages  88  37  42%  31  35.2%  No  Yes (All Colleges)  Yes 
History and Politics  342  71  20.8%  67  19.6%  No  Yes (Hughes Hall, Newnham, Peterhouse and St Edmund’s Colleges)  Yes 
History of Art  87  37  42.5%  31  35.6%  No  No  No 
History  607  213  35.1%  164  27%  No  Yes (Hughes Hall, Newnham, Peterhouse and St Edmund’s Colleges)  Yes 
Human, Social, and Political Sciences  1436  219  15.3%  166  11.6%  No  Yes (Hughes Hall, King’s, Newnham and Peterhouse Colleges)  Yes 
Land Economy  629  92  14.6%  71  11.3%  No  No  Yes (Some Colleges) 
Law  1580  280  17.7%  230  14.6%  LNAT (National Admissions Test for Law)  No  Yes (Some Colleges) 
Linguistics  119  44  37%  26  21.8%  No  Yes (all Colleges except Christ’s College)  Yes (Some Colleges) 
Mathematics  1588  524  33%  258  16.2%  STEP (Sixth-Term Examination Paper)  Yes (Churchill, King’s and St Edmund’s)  No 
Medicine  1754  288  16.4%  273  15.6%  UCAT (University Clinical Aptitude Test)  No  No 
Modern and Medieval Languages (MML)  254  155  61%  128  50.4%  No  Yes (All Colleges)  Yes 
Music  140  78  55.7%  51  36.4%  No  Yes (Downing, Girton, Jesus, Magdalene, Newnham, Queens’, Robinson, Selwyn, St John’s and Trinity Hall Colleges)  Yes 
Natural Sciences  2444  626  25.6%  547  22.4%  ESAT (Engineering and Science Admissions Test)  No  No 
Philosophy  306  69  22.5%  50  16.3%  No  Yes (All Colleges)  No 
Psychological and Behavioural Sciences (PBS)  891  104  11.7%  81  9.1%  No  Yes (Gonville & Caius, Homerton, Newnham, Selwyn and St Edmund’s Colleges)  Yes (Some Colleges) 
Theology, Religion, and Philosophy of Religion  105  46  43.8%  37  35.2%  No  Yes (Pembroke and St Edmund’s Colleges)  Yes 
Veterinary Medicine  333  90  27%  73  21.9%  ESAT (Engineering and Science Admissions Test)  No  No 
Total  21445  4553  21.2%  3557  16.6%       

Cambridge in Recent Years

Numbers and Percentage Changes

Application Year  Applications  % Change in Applications  Offers  % Change in Offers  Acceptances  % Change in Acceptances 
2020  20,426    4,710    3,997   
2021  22,795  11.6%  4,260  -9.6%  3,660  -8.4% 
2022  22,470  -1.4%  4,238  -0.5%  3,544  -3.2% 
2023  21,445  -4.6%  4,553  7.4%  3,557  0.4% 


Rates

Application Year  Applications  Offers  Offer Rate  Acceptances  Acceptance Rate  Trends 
2020  20,426  4,710  23.1%  3,997  19.6%   
2021  22,795  4,260  18.7%  3,660  16.1%  Decrease by several percentage points in offer and acceptance rates alongside increase in applications and decrease in offers and acceptances. 
2022  22,470  4,238  18.9%  3,544  15.8%  Stable offer and acceptance rates due to consistent numbers in applications, offers, and acceptances. 
2023  21,445  4,553  21.2%  3,557  16.6%  Increase in offer rate and slight increase in acceptance rate due to a decrease in application numbers and stable offers and acceptances. 


Applications to Cambridge picked up in 2021 following the COVID pandemic, which began in 2020. In 2021, offer and acceptance rates both took a significant dip compared to the previous year.  

In 2023, we see offer rates creeping back up towards their 2020 level, with acceptance rates also increasing but at a slower rate.  

Overall application numbers were down in 2023 by almost 5% on the previous year, whilst offers increased by 7.5%, contributing to the noticeable increase in offer rates this year.  

In short, whilst 2023 was not out of the ordinary given previous years, both offer and acceptance rates are higher than they have been since 2020, which is hopefully good news for applicants in 2024. 

Most Competitive Cambridge Courses

By Offer Rate

Subject  Offer Rate 
Computer Science  9.3% 
Psychological & Behavioural Sciences  11.7% 
Economics  13.7% 
Land Economy  14.6% 
Human, Social, & Political Sciences  15.3% 
Engineering  15.4% 
Medicine  16.4% 
Law  17.7% 
Architecture  18.4% 
History and Politics  20.8% 

By Acceptance Rate

Subject  Acceptance Rate 
Computer Science  7.6% 
Psychological & Behavioural Sciences  9.1% 
Land Economy  11.3% 
Architecture  11.5% 
Human, Social & Political Sciences  11.6% 
Economics  12.1% 
Engineering  13.8% 
Law  14.6% 
Medicine  15.6% 
Mathematics  16.2% 


Looking at both of the above lists, we can see that Computer Science is consistently the most difficult course to get into at Cambridge University. This is the same as Oxford University; across the board, Computer Science is a very competitive course to get into at UK universities in general.  

As these lists also demonstrate, the hardest courses to get into at Cambridge consist relatively evenly of sciences (4 of the 10 lowest offer rates and 5 of the 10 lowest acceptance rates) and humanities/social sciences.   

Least Competitive Cambridge Courses

By Offer Rate

Subject  Offer Rate  
Modern and Medieval Languages  61% 
Anglo-Saxon, Norse, and Celtic  58.1% 
Archaeology  56.1% 
Music  55.7% 
Classics  46.8% 
Theology, Religion, and Philosophy of Religion  43.8% 
History of Art  42.5% 
History and Modern Languages  42% 
Asian and Middle Eastern Studies  41.1% 
Linguistics  37% 

By Acceptance Rate

Subject  Acceptance Rate 
Modern and Medieval Languages  50.4% 
Classics  39.7% 
Archaeology  39% 
Music  36.4% 
History of Art  35.6% 
Theology, Religion, and Philosophy of Religion  35.2% 
History and Modern Languages  35.2% 
Asian and Middle Eastern Studies  32.2% 
Anglo-Saxon, Norse, and Celtic  30.6% 
History  27% 


Once again, the top ten courses for offer rate and acceptance rate are relatively consistent;  Modern and Medieval Languages (MML) is by far and away the ‘easiest’ course to get into at the University of Cambridge, with a whopping 61% of applicants receiving an offer, and 50.4% eventually being accepted onto the course.  

Whilst the hardest courses to get into were a mixture of sciences and humanities/social sciences, the easiest courses to get into are exclusively humanities subjects. In fact, the first sciences to appear on either list are Mathematics with the 12th highest offer rate (33%) and Natural Sciences with the 12th highest success rate (22.4%). From this we can conclude that, generally speaking, essay-based humanities topics have the highest offer and acceptance rates.  

As these lists also demonstrate, the hardest courses to get into at Cambridge consist relatively evenly of sciences (4 of the 10 lowest offer rates and 5 of the 10 lowest acceptance rates) and humanities/social sciences.   

Arts, Humanities, and Social Sciences Versus Sciences

Subject Category  Applications  % of Total Applications  Offers  % of Total Offers  Offer Rate  Acceptances  % of Total Acceptances  Acceptance Rate 
Arts, Humanities and Social Sciences  9,251  44.4%  2,271  49.9%  23.9%  1,764  49.6%  18.5% 
Sciences  11,924  55.6%  2,282  50.1%  19.1%  1,793  50.4%  15.0% 

Whilst Sciences make up the majority of applications to Cambridge (10% more than Humanities and Social Sciences), the number of offers and acceptances are, in fact, far closer to 50% between the two. This is explained by the higher offer and acceptance rate onto Humanities and Social Sciences courses compared to Sciences.  

In simple terms, the chance of being accepted onto a humanities or social sciences course appears to be higher than onto sciences. Of course, one should consult the specific course to which they are applying to see if their course follows the trend.  

As our analysis of lowest and highest offer/acceptance rates above suggests, social sciences (such as Economy, HSPS, and Land Economy) tend to be far more competitive than arts and humanities (such as MML, classics, archaeology, or music). In fact, all the ten subjects with highest acceptance rates are arts and humanities rather than social sciences.  


Difference Between Offer Rate and Acceptance Rate


Why are offer rates and acceptance rates different? In short, offer rate refers to the percentage of applicants who receive an offer in the winter, whilst acceptance rate refers to the percentage of applicants who are accepted onto the course in the summer (almost all of whom, barring exceptional circumstances, begin the course in October).   

What influences a student with an offer to not be eventually accepted? The prime reason for an applicant with an offer not to be accepted is that they have not fulfilled the terms of their offer. This usually means that they did not get sufficient grades in their A-level or equivalent exams.  

Sometimes it is something other than their school qualifications, such as in Maths where the STEP admissions test (held in the summer alongside A-levels) is also part of the offer. It also accounts for applicants who chose to pursue another course and withdrew their application between receiving their offer and attending university (although, this being the University of Cambridge, this is presumably not very common).  

Let’s briefly explore the subjects with the largest differences between offer rate and acceptance rate (i.e. with the most applicants who received an offer but did not then begin the degree course). The ‘percentage of offers not accepted’ is the main metric we are using here; it indicates the percentage of applicants offered a place who were not then accepted onto the course. 

Subject  Offers  Acceptances  Percentage of offers not accepted 
Mathematics  524  258  50.8% 
Anglo-Saxon, Norse, and Celtic  36  19  47.2% 
Linguistics  44  26  40.9% 
Architecture  96  60  37.5% 
Music  78  51  34.6% 
Education  50  34  32.0% 
Archaeology  46  32  30.4% 
Geography  138  99  28.3% 
Philosophy  69  50  27.5% 
Human, Social, and Political Sciences  219  166  24.2% 

The first thing we notice is that Mathematics, despite being a large and very popular course, saw a huge number of offers not accepted in 2023. The most likely reason for this is that the STEP (Sixth-Term Examination Paper) admissions test, used by the Cambridge Maths Department, is taken in the summer alongside A-level exams, rather than before shortlisting or interview like the assessments for other subjects.  

This means that Maths applicants at Cambridge have an additional hurdle to get over to fulfil the terms of their offer.  

Aside from Mathematics, every other subject in the top ten here is an Arts, Humanities, or Social Science subject. Whilst this isn’t an incredibly significant result (since there are simply more Humanities subjects than Sciences on offer), it does indicate that humanities are slightly less predictable when it comes to whether applicants are going to make the grades in their offer.  

We know that essay-based subjects such as English, History, Languages, Art, or Music (which applicants to humanities degrees are more likely to be taking at A-Level) can be more subjective in their marking, so perhaps this plays a role.  

We would advise against reading into your particular subject on this metric alone, since it is very susceptible to unique occurrences in a given year (especially for smaller subject, such as ASNC, Linguistics, Education, or Archaeology).  


Subject Size

Subjects with the Largest Number of Offers 

Subject  Applicants  Offers  Offer Rate  Acceptances  Acceptance Rate 
Natural Sciences  2444  626  25.6%  547  22.4% 
Mathematics  1588  524  33%  258  16.2% 
Engineering  2410  370  15.4%  333  13.8% 
Medicine  1754  288  16.4%  273  15.6% 
Law  1580  280  17.7%  230  14.6% 
English  756  222  29.4%  187  24.7% 
Human, Social, and Political Sciences  1436  219  15.3%  166  11.6% 
History  607  213  35.1%  164  27% 
Average        23.5%     18.2% 


Subjects with the Smallest Number of Offers

Subject  Applicants  Offers  Offer Rate  Acceptances  Acceptance Rate 
Asian and Middle Eastern Studies (AMES)  124  51  41.10%  40  32.20% 
Education  190  50  26.30%  34  17.90% 
Theology, Religion, and Philosophy of Religion  105  46  43.80%  37  35.20% 
Archaeology  82  46  56.10%  32  39% 
Linguistics  119  44  37%  26  21.80% 
History and Modern Languages  88  37  42%  31  35.20% 
History of Art  87  37  42.50%  31  35.60% 
Anglo-Saxon, Norse, and Celtic  62  36  58.10%  19  30.60% 
Average        43.4%     30.9% 


Here we have used number of offers as the key metric to determine the largest and smallest course, since it’s largely indicative of how many places are available on the course (although slightly inflated to account for people missing their offers).  

As we see from the averages above, there is a significant difference in offer and acceptance rates when comparing the subjects with the largest and the smallest number of offers. Despite the smaller and more niche subjects in the second table having far smaller quotas for admissions (i.e. they offer far fewer places than the larger subjects), the much greater competition for the larger courses overrules this, making them more competitive overall.   

It is worth pointing out, however, that the subject with the highest offer and acceptance rate, Modern and Medieval Languages, is a relatively major, mainstream course (it is tenth in the list of most offers given out). 

In short, make sure to look at the statistics for the particular course to which you are applying to see if it follows this trend.   

Joint Versus Single Honours

One question we are asked a lot is whether applying for single or joint honours is a better strategy for Oxbridge acceptance. Whilst Cambridge do not offer a large number of joint honour subjects (due to their Tripos system, which we cover in our blog here), we have compared the joint subjects (largely consisting of languages and history) to see if there are any notable trends.  

Subject  Applicants  Offers  Offer Rate  Acceptances  Acceptance Rate 
Modern and Medieval Languages (MML)  254  155  61%  128  50.40% 
History and Modern Languages  88  37  42%  31  35.20% 
History  607  213  35.10%  164  27% 
History and Politics  342  71  20.80%  67  19.60% 
Humanities and Social Sciences (Average)  9251  2271  23.90%  1764  18.50% 

Looking at the above table, we see a mixed bag of results. History and Modern Languages, the more popular of the joint courses, sees results slap bang in the middle of its constituent single honours degrees, MML and History. Therefore, an applicant most interested in languages considering adding History to their application might be dissuaded from applying to the joint course.  

However, a historian with an interest in pursuing languages on the side might be encouraged to apply for the joint degree and up their chances of success. 

History and Politics is a different story, however, with a far lower offer and acceptance rate compared to History alone; the offer rate for History and Politics is even lower than the average across Humanities and Social Sciences, making it a pretty competitive course.  

What we see overall, however, is that there is no hard and fast rule when it comes to strategizing over joint honours at Cambridge. We recommend that applicants look at the specific course figures, and consider their own abilities when it comes to potentially juggling more A-Level requirements and admissions tests as part of their application.  

Do Admissions Tests Have an Impact on the Figures?

Another question we are frequently asked is to what extent sitting an admissions test may or may not impact an applicant’s chances. In the tables below we have split the subjects into three categories: courses with a pre-registered admissions test, courses with a college at-interview admissions assessment only (where the test is used by four or more colleges), and courses with no admissions assessment (or courses where three or fewer colleges use an at-interview admissions assessment).  


Courses with Pre-Registered Admissions Tests (ESAT, LNAT, STEP, TMUA, or UCAT)

Subject  Applicants  Offers  Offer Rate  Acceptances  Acceptance Rate  Pre-Registered Admissions Test  College Admissions Assessment 
Natural Sciences  2444  626  25.60%  547  22.40%  ESAT (Engineering and Science Admissions Test)  No 
Veterinary Medicine  333  90  27%  73  21.90%  ESAT (Engineering and Science Admissions Test)  No 
Chemical Engineering and Biotechnology  373  88  23.60%  67  18%  ESAT (Engineering and Science Admissions Test)  No 
Engineering  2410  370  15.40%  333  13.80%  ESAT (Engineering and Science Admissions Test)  No 
Law  1580  280  17.70%  230  14.60%  LNAT (National Admissions Test for Law)  No 
Mathematics  1588  524  33%  258  16.20%  STEP (Sixth-Term Examination Paper)  Yes (Churchill, King’s and St Edmund’s) 
Economics  1336  183  13.70%  162  12.10%  TMUA (Test of Mathematics for University Admissions)  No 
Computer Science  1583  147  9.30%  121  7.60%  TMUA (Test of Mathematics for University Admissions)  Yes (Peterhouse and Trinity Colleges: Computer Sciences Aptitude Test) 
Medicine  1754  288  16.40%  273  15.60%  UCAT (University Clinical Aptitude Test)  No 
Averages      20.19% 


  15.80% 


Courses with College At-Interview Admissions Assessments Only (Where Admissions Assessments are Used By Four or More Colleges)

Subject  Applicants  Offers  Offer Rate  Acceptances  Acceptance Rate  Pre-Registered Admissions Test  College Admissions Assessment 
Linguistics  119  44  37%  26  21.80%  No  Yes (all Colleges except Christ’s College) 
Modern and Medieval Languages (MML)  254  155  61%  128  50.40%  No  Yes (All Colleges) 
Classics  126  59  46.80%  50  39.70%  No  Yes (All Colleges) 
Archaeology  82  46  56.10%  32  39%  No  Yes (All Colleges) 
History and Modern Languages  88  37  42%  31  35.20%  No  Yes (All Colleges) 
English  756  222  29.40%  187  24.70%  No  Yes (All Colleges) 
Philosophy  306  69  22.50%  50  16.30%  No  Yes (All Colleges) 
Architecture  522  96  18.40%  60  11.50%  No  Yes (All Colleges) 
Music  140  78  55.70%  51  36.40%  No  Yes (Downing, Girton, Jesus, Magdalene, Newnham, Queens’, Robinson, Selwyn, St John’s and Trinity Hall Colleges) 
Psychological and Behavioural Sciences  891  104  11.70%  81  9.10%  No  Yes (Gonville & Caius, Homerton, Newnham, Selwyn and St Edmund’s Colleges) 
Human, Social, and Political Sciences  1436  219  15.30%  166  11.60%  No  Yes (Hughes Hall, King’s, Newnham and Peterhouse Colleges) 
History  607  213  35.10%  164  27%  No  Yes (Hughes Hall, Newnham, Peterhouse and St Edmund’s Colleges) 
History and Politics  342  71  20.80%  67  19.60%  No  Yes (Hughes Hall, Newnham, Peterhouse and St Edmund’s Colleges) 
 Averages      34.75%    26.33%     


Courses Without Admissions Tests (excluding College Admissions Assessments at three or fewer colleges)

Subject  Applicants  Offers  Offer Rate  Acceptances  Acceptance Rate  Pre-Registered Admissions Test  College Admissions Assessment 
History of Art  87  37  42.50%  31  35.60%  No  No 
Anglo-Saxon, Norse, and Celtic  62  36  58.10%  19  30.60%  No  No 
Education  190  50  26.30%  34  17.90%  No  No 
Land Economy  629  92  14.60%  71  11.30%  No  No 
Asian and Middle Eastern Studies (AMES)  124  51  41.10%  40  32.20%  No  Yes (King’s and St Edmund’s Colleges) 
Theology, Religion, and Philosophy of Religion  105  46  43.80%  37  35.20%  No  Yes (Pembroke and St Edmund’s Colleges) 
Geography  524  138  26.30%  99  18.90%  No  Yes (Hughes Hall and St Edmund’s Colleges) 
Average      36.10%    25.96%     


Averages

Admissions Test Category  Average Offer Rate  Average Acceptance Rate 
Pre-Registered Test  20.19%  15.8% 
College Admissions Assessment (for Shortlisted Applicants)  34.75%  26.33% 
No Admissions Assessment  36.1%  25.96% 


In 2023, it is clear that Cambridge courses with Pre-Registered Admissions Tests (the ESAT, LNAT, TMUA, STEP, or UCAT) were by far more competitive on average than either courses with College At-Interview Admissions Assessments or no assessment at all.  

Additionally, there appears to be little meaningful difference in the average numbers between courses with College At-Interview Assessments and those without.  

Do these results mean we can say that admissions tests make your chances of success lower? Not exactly.  

Rather than admissions tests making an application more difficult (although undoubtedly, in many cases it does), we instead interpret these results as indicating the tendency of Cambridge University to use admissions tests for the courses that are more competitive in the first place.  

The main purpose of a pre-registered admissions test is to help admissions tutors decide between lots of impressive applicants on the more competitive courses. In fact, there is only one course which received over 1,000 applicants which does not use a pre-registered admissions assessment (HSPS): every other course with over 1,000 applicants uses one. This means the admissions tests generally are a result of the high competition on certain courses, not the other way round. 

One of the most frequently asked questions we receive from Oxbridge applicants is “what are my chances of making a successful application to Oxford or Cambridge?” Our first response is always this: the answer varies depending on course choice, as well as your grades and personal strengths and weaknesses; there is no certain statistic that can tell you whether or not you will be accepted to a certain course or university. This being said, looking at the cold hard facts (i.e. admissions statistics) can be helpful when used as just one part of the decision-making process.

In this article we have compiled the success rates for all undergraduate courses at Oxford and Cambridge Universities in 2023. We recommend looking through the metrics for the course(s) you are interested in and weighing them up alongside your personal reasons for/against each course. We have also included whether a given course uses an admissions test and/or written work, since these may also impact your decision when it comes to picking a course. 

Introduction to the Metrics:

For more advice on how to use these statistics to your advantage, our expert consultants are available 9am-5pm every weekday to discuss your individual situation. Call them on +44 (0) 20 7499 2394 or email [email protected].

Oxford 2023 Success Rates

Course

Applications 

Shortlisted 

Shortlisting Rate

Offers 

Offer Rate

Acceptances 

Acceptance Rate

Pre-interview Admissions Test?

Written Work Typically Required?

Archaeology and Anthropology

125

68

54%

25

20%

22

18%

No

Yes

Asian and Middle Eastern Studies (AMES)

109

97

89%

46

42%

35

32%

No

Yes

Biochemistry

875

366

42%

115

13%

100

11%

No

No

Biology

742

343

46%

128

17%

109

15%

No

No

Biomedical Sciences

490

117

24%

46

9%

41

8%

BMSAT (Biomedical Sciences Admissions Test)

No

Chemistry

1015

658

65%

207

20%

175

17%

No

No

Classical Archaeology and Ancient History (CAAH)

152

142

93%

32

21%

25

16%

AHCAAT (Ancient History and Classical Archaeology Admissions Test)

Yes

Classics

313

302

96%

118

38%

100

32%

CAT (Classics Admissions Test)

Yes

Classics and English

60

53

88%

15

25%

13

22%

CAT (Classics Admissions Test)

Yes

Classics and Modern Languages

23

22

96%

10

43%

10

43%

CAT (Classics Admissions Test); MLAT (Modern Languages Admissions Test)

Yes

Computer Science

866

155

18%

59

7%

52

6%

MAT (Mathematics Admissions Test)

No

Computer Science and Philosophy

129

47

36%

15

12%

12

9%

MAT (Mathematics Admissions Test)

No

Earth Sciences (Geology)

163

144

88%

42

26%

34

21%

No

No

Economics and Management

1542

271

18%

91

6%

83

5%

TSA (Thinking Skills Assessment) Section 1

No

Engineering Science

1031

417

40%

196

19%

163

16%

PAT (Physics Admissions Test)

No

English Language and Literature

975

631

65%

249

26%

212

22%

No

Yes

English and Modern Languages

91

80

88%

37

41%

35

38%

MLAT (Modern Languages Admissions Test)

Yes

European and Middle Eastern Languages

40

35

88%

15

38%

13

33%

MLAT (Modern Languages Admissions Test)

Yes

Fine Art

255

52

20%

31

12%

28

11%

No

Yes (Portfolio)

Geography

339

247

73%

90

27%

70

21%

No

No

History

958

664

69%

254

27%

214

22%

HAT (History Admissions Test)

Yes

History (Ancient and Modern)

98

69

70%

23

23%

20

20%

HAT (History Admissions Test)

Yes

History and Economics

158

61

39%

19

12%

18

11%

HAT (History Admissions Test); TSA (Thinking Skills Assessment) Section 1

Yes

History and English

104

52

50%

13

13%

12

12%

HAT (History Admissions Test)

Yes

History and Modern Languages

72

56

78%

19

26%

18

25%

HAT (History Admissions Test); MLAT (Modern Languages Admissions Test)

Yes

History and Politics

381

142

37%

54

14%

48

13%

HAT (History Admissions Test)

Yes

History of Art

107

49

46%

16

15%

14

13%

No

Yes

Human Sciences

193

92

48%

32

17%

26

13%

TSA (Thinking Skills Assessment) Section 1

No

Law

1858

606

33%

219

12%

192

10%

LNAT (Law National Admissions Test)

No

Materials Science

148

112

76%

48

32%

44

30%

PAT (Physics Admissions Test)

No

Mathematics

1807

544

30%

193

11%

179

10%

MAT (Mathematics Admissions Test)

No

Mathematics and Computer Science

593

150

25%

65

11%

51

9%

MAT (Mathematics Admissions Test)

No

Mathematics and Philosophy

163

62

38%

20

12%

19

12%

MAT (Mathematics Admissions Test)

No

Mathematics and Statistics

142

23

16%

5

4%

3

2%

MAT (Mathematics Admissions Test)

No

Medicine

1712

428

25%

162

9%

149

9%

UCAT (University Clinical Aptitude Test)

No

Modern Languages

309

290

94%

171

55%

145

47%

MLAT (Modern Languages Admissions Test)

Yes

Modern Languages and Linguistics

91

85

93%

41

45%

39

43%

MLAT (Modern Languages Admissions Test)

Yes

Music

169

153

91%

91

54%

81

48%

No (Students will be asked to submit a video-recorded performance)

Yes

Philosophy and Modern Languages

56

52

93%

24

43%

21

38%

MLAT (Modern Languages Admissions Test)

Yes

Philosophy and Theology

146

58

40%

28

19%

25

17%

PhilAT (Philosophy Admissions Test)

Yes

Philosophy, Politics and Economics (PPE)

1864

718

39%

265

14%

229

12%

TSA (Thinking Skills Assessment)

No

Physics

1494

470

31%

190

13%

174

12%

PAT (Physics Admissions Test)

No

Physics and Philosophy

139

28

20%

15

11%

12

9%

PAT (Physics Admissions Test)

No

Psychology (Experimental)

379

139

37%

56

15%

43

11%

TSA (Thinking Skills Assessment) Section 1

No

Psychology, Philosophy, and Linguistics (PPL)

275

99

36%

48

17%

38

14%

TSA (Thinking Skills Assessment) Section 1

No

Religion and Asian and Middle Eastern Studies

3

1

33%

1

33%

1

33%

No

Yes

Theology and Religion

116

85

73%

54

47%

46

40%

No

Yes

Total

23211

9621

41%

3721

16%

3219

14%


Cambridge 2023 Success Rates

A note on Design at Cambridge University: The Cambridge Design degree is a new course for 2024 entry; as such, there is no information on admissions statistics yet available, Once 2024 applications statistics have been released by the University, our tables will be updated accordingly to include Design. 

Course

Applications

Offers

Offer Rate

Acceptances

Acceptance Rate

Pre-interview Admissions Test?

College Admissions Assessment (usually At-Interview)

Written Work Typically Required?

Anglo-Saxon, Norse, and Celtic

62

36

58.1%

19

30.6%

No

No

Yes

Archaeology

82

46

56.1%

32

39%

No

Yes (All Colleges)

Yes

Architecture

522

96

18.4%

60

11.5%

No

Yes (All Colleges)

Yes (Portfolio submission)

Asian and Middle Eastern Studies (AMES)

124

51

41.1%

40

32.2%

No

Yes (King’s and St Edmund’s Colleges)

No

Chemical Engineering and Biotechnology

373

88

23.6%

67

18%

ESAT (Engineering and Science Admissions Test)

No

No

Classics

126

59

46.8%

50

39.7%

No

Yes (All Colleges)

Yes

Computer Science

1583

147

9.3%

121

7.6%

TMUA (Test of Mathematics for University Admissions)

Yes (Peterhouse and Trinity Colleges: Computer Sciences Aptitude Test)

No

Economics

1336

183

13.7%

162

12.1%

TMUA (Test of Mathematics for University Admissions)

No

No

Education

190

50

26.3%

34

17.9%

No

No

Yes

Engineering

2410

370

15.4%

333

13.8%

ESAT (Engineering and Science Admissions Test)

No

No

English

756

222

29.4%

187

24.7%

No

Yes (All Colleges)

Yes

Geography

524

138

26.3%

99

18.9%

No

Yes (Hughes Hall and St Edmund’s Colleges)

No

History and Modern Languages

88

37

42%

31

35.2%

No

Yes (All Colleges)

Yes

History and Politics

342

71

20.8%

67

19.6%

No

Yes (Hughes Hall, Newnham, Peterhouse and St Edmund’s Colleges)

Yes

History of Art

87

37

42.5%

31

35.6%

No

No

No

History

607

213

35.1%

164

27%

No

Yes (Hughes Hall, Newnham, Peterhouse and St Edmund’s Colleges)

Yes

Human, Social, and Political Sciences

1436

219

15.3%

166

11.6%

No

Yes (Hughes Hall, King’s, Newnham and Peterhouse Colleges)

Yes

Land Economy

629

92

14.6%

71

11.3%

No

No

Yes (Some Colleges)

Law

1580

280

17.7%

230

14.6%

LNAT (National Admissions Test for Law)

No

Yes (Some Colleges)

Linguistics

119

44

37%

26

21.8%

No

Yes (all Colleges except Christ’s College)

Yes (Some Colleges)

Mathematics

1588

524

33%

258

16.2%

STEP (Sixth-Term Examination Paper)

Yes (Churchill, King’s and St Edmund’s)

No

Medicine

1754

288

16.4%

273

15.6%

UCAT (University Clinical Aptitude Test)

No

No

Modern and Medieval Languages (MML)

254

155

61%

128

50.4%

No

Yes (All Colleges)

Yes

Music

140

78

55.7%

51

36.4%

No

Yes (Downing, Girton, Jesus, Magdalene, Newnham, Queens’, Robinson, Selwyn, St John’s and Trinity Hall Colleges)

Yes

Natural Sciences

2444

626

25.6%

547

22.4%

ESAT (Engineering and Science Admissions Test)

No

No

Philosophy

306

69

22.5%

50

16.3%

No

Yes (All Colleges)

No

Psychological and Behavioural Sciences

891

104

11.7%

81

9.1%

No

Yes (Gonville & Caius, Homerton, Newnham, Selwyn and St Edmund’s Colleges)

Yes (Some Colleges)

Theology, Religion, and Philosophy of Religion

105

46

43.8%

37

35.2%

No

Yes (Pembroke and St Edmund’s Colleges)

Yes

Veterinary Medicine

333

90

27%

73

21.9%

ESAT (Engineering and Science Admissions Test)

No

No

Total

21445

4553

21.2%

3557

16.6%


Want to find out what your chances are of getting into Oxford or Cambridge? Every year we survey hundreds of people who applied the previous year, giving you crucial statistical insight into the probability of gaining a place. 

We have gathered information on all elements of the Oxford and Cambridge application processes, from which schools students came from, to whether they were asked about their personal statements at interview, and what further help they would like if they were to apply again. 

The most interesting information is found in this report…


Email us for more info


2014 Annual Survey


There are a number of advantages to taking a gap year, which often come across during interviews. Gap year applicants may be more comfortable speaking to superiors in a one-to-one situation, having taken a break from the hierarchy of school or college. Gap years can help students develop a broader outlook and become more flexible in their approach to new ideas or questions thrown at them.

However, whilst it is perfectly valid to go travelling or work for a charity during a gap year, this is unlikely to have much of an effect on your application to Oxford or Cambridge, since the admissions tutors would only be interested in experiences that are relevant to your subject. If you are considering a gap year, it is worth doing something relevant to your subject in the summer after you finish school which you can then mention in your personal statement and/or interview.

What do the Universities really think of gap years?

As in other areas of the Oxbridge admissions, there is no standard policy and the answer is down to individual tutors at different colleges making subjective choices. There are, however, some guidelines which can help.

With some of the ‘hard’, technical subjects (Maths, Physics, Medicine etc.) there is sometimes a fear among tutors that as a result of a year away from studying, students may lose the precision and the skills they have honed in their sixth form studies.

For Maths, the official line from Cambridge University is “If you’re applying for Mathematics, most Colleges have a preference for immediate entry.” Oxford takes a similar stance, stating “applications for deferred entry are discouraged, unless the plans for the gap year have a substantial mathematical component.”

For Physics, Oxford’s faculty states that if you are thinking about taking a gap year, you should ‘discuss your plans with the tutors at your chosen college.’ They go on to state that some sponsorship schemes offering a year’s work experience in a physics-related field ‘are excellent.’ Two good websites to look at include ‘The Year in Industry’ – which has contacts with a number of companies who might be able to assist with suitable ‘science based’ schemes for a gap year. You should also check out the Institute of Physics.  

For Engineering, some Cambridge colleges actively encourage a gap year (check the prospectus for further details).

If you are considering Languages, taking a gap year can be a great decision if you spend it abroad, to improve your language skills and appreciation of a foreign culture. (And by culture, we don’t mean lying on the beach soaking up the atmosphere… as relaxing as that can be).


Deferred Entry

Advantages: If you are unsuccessful in securing a deferred place, you then have the option of reapplying post A-level or equivalent the following year and still taking a gap year.

Disadvantages: By applying for a deferred place, you are asking the tutors to save you a place without knowing the standard of next year’s applicants. So if you are applying in 2018 for entry in 2020, you have to convince the tutors that you’re not only amongst the top candidates they are interviewing this year, but also that you will be one of the best applicants next year, which is a gamble for the tutors.

Post A-level (or equivalent)

Advantages: the main advantage of applying post A-level (or equivalent) is that you will be applying with achieved rather than predicted grades. This is a big incentive for universities as they can make unconditional offers and will not have the uncertainty of you not achieving the required grades.

Disadvantages:  if you are unsuccessful, you would only be able to reapply if you then took two gap years – not a particularly engaging prospect for a university. Also, you need to think carefully as to whether your grades will definitely meet the criteria. When it comes to applying you will be doing so with your ‘real grades.’ 

Travelling tips

If you do decide to take a gap year, here are our suggestions for making the most of your year out of study: 

Plan:  Make sure you spend some time planning your gap year so you strike the right balance between work and play. Remember, if you’re applying to Oxbridge after university you will need to be in the country until at least December for the applications process. It may well be worth spending a good chunk of this time preparing. Since many of your competitors will still be at school studying for their A-levels, this will give you an advantage.

Research: It’s no good planning a round the world trip if you don’t have the funds to pay for it. Once you’ve planned what you would like to do, research the cost and the time frame. You can’t do a ski season in Vermont if you need to be in Cambridge for interviews during December. If you are undecided as to what you want to do, speak to people – whether older friends, teachers or travel advisors – to see what they suggest.

Be logical: Is it worth sacrificing a place at one of the top ten universities in the world for a year of hedonism? Be prepared to dedicate at least the first third of your gap year to university applications, and this includes summer activities. Brainstorm how you could utilise your free time to make your application stand out. Do things you could write about in your personal statement and talk confidently about at interview: you might decide to attend a summer course, do work experience or even find a part-time job which ties in with your subject. 

pound coinsMany people are under the impression that it is more expensive to study at Oxford or Cambridge. This is emphatically not the case.

Government changes to student finance in recent years have caused some people to rethink their higher education options, reluctant to graduate in debt. A certain amount of student loan debt is unavoidable, but both Oxford and Cambridge are determined that no one should be put off from applying because of financial considerations and they have taken action accordingly.

Furthermore, the collegiate system, which does not cost Home and EU students extra, not only means extra funding opportunities, but also cheaper living costs with college accommodation. Of course, rents vary, but crucially, you don’t have to pay during the vacations, only for the eight-week terms when you are in residence.

Maintenance Bursaries from the Universities

The Oxford Opportunity Bursary (OOB) and the Cambridge Bursary have been developed to help students who are already in receipt of a government maintenance grant, meet their remaining living costs. The bursaries are means tested and awarded on a sliding scale, i.e. the lower your household’s residual income the more money you will receive. These figures are re-assessed each year of your degree, so if your financial situation does not change you will continue to receive the same level of support, but if your needs change this will be reflected in the amount of bursary you receive.

If you qualify for the maximum government maintenance grant, then you will receive the maximum bursary available, and this combined amount is intended to cover all of your living costs. It should therefore not be necessary to take out a student maintenance loan in addition to the statutory student loan covering tuition fees.

The OOB provides an additional start-up fund designed to cover the initial costs of university, e.g. specialist books and equipment, a computer, or items necessary for living away from home for the first time. Whilst the Cambridge Bursary does not provide this initial boost for poorer students, the cut off point to qualify for a bursary, in terms of residual income, is higher than the OOB, so more students receive support.

For the OOB, both you and each of your sponsors (i.e. both parents if both contribute to your household income) must consent to have your financial details shared with the University by signing the relevant part of your application for student support that you make to your Local Authority each year. For the Cambridge Bursary, your College provides you with a form when you arrive in Cambridge.

College Funding

The colleges at Oxford and Cambridge tend to look after their students very well. Although the type of support and amount of funding varies from college to college, often depending upon how relatively rich or poor they are, the following is typical of what most colleges offer:

  • Hardship Funds – for students in financial need. These may be in the form of short-term loans, grants or bursaries.
  • Scholarships, Exhibitions and College Prizes – awarded for excellent academic achievement.
  • Study Grants – to cover accommodation for students staying at university outside of term-time to continue studying.
  • Travel Grants – to cover costs of a trip related to academic work.
  • Book and Equipment Grants – to cover the cost of purchasing essential items for your degree.
  • Job Opportunities – both Oxford and Cambridge discourage part time jobs during term-time, but there are a few approved ways to earn money whilst studying, e.g. in a college library or bar. There is a huge range of full time opportunities during vacations, from retail jobs, through to assisting on summer schools, and research work. Many students enjoy being able to stay in town whilst earning money and preparing for the term ahead.

University access

Oxford and Cambridge aim to offer places to the best students with the highest level of academic potential in their chosen subject.  Both Oxford and Cambridge universities put a huge amount of time, effort and resources into attracting the top students from all sorts of different backgrounds, and are determined that no student should be deterred from applying due to financial or social considerations.  Theoretically, no-one is at a disadvantage – apart from those who don’t apply.

What are the first steps?

The first step for students thinking about applying to Oxford or Cambridge is to attend one of the nationwide Oxford and Cambridge Student Conferences, held in March every year by the universities. Open to all students, these events offer a huge range of information and the opportunity to speak to current students and discuss their experiences. 

In addition to this, both universities run a number of schemes and initiatives throughout the year to attract the best students regardless of background, and to ensure that each and every student is considered individually when they apply.

Merton College Oxford UniversityOxford

  • UNIQ: summer school gives year 12 students from state schools the chance to live the Oxford student life for a whole week – to form their own opinions and decide whether it’s right for them. (UNIQ replaces the summer school previously organised through the Sutton Trust.  Our very own previous Managing Director, Rachel, attended a Sutton Trust Summer School at Cambridge when she applied).
  • Target Schools is a student-run organisation hosting a number of schemes to encourage applications from all backgrounds.  For example, a student-shadowing scheme enabling pupils to come to Oxford for a day, shadow an undergraduate and attend workshops on interview techniques, essay writing, and possibly even mock-tutorials.
  • Oxford, like Cambridge, is committed to accessibility for disabled applicants and students. The Disability Office can be contacted on [email protected]
  • The Oxford FE Access Initiative runs a series of events across schools and FE colleges, including interview workshops, Oxford visits, talks for students from alternative educational backgrounds and staff presentations and workshops. 

Cambridge universityCambridge

  • Cambridge Special Access Scheme (CSAS) is a system designed to provide the Colleges and admissions tutors with the information required to fairly assess each candidate.  Students with particular social, personal or educational disruption or disadvantage are encouraged to apply through the CSAS (form available online), as well as those whose family or school does not have a history of sending students to university or to Oxbridge.  Laying out your personal experience and information to the tutors allows them the opportunity to place your achievements into a wider context, ensuring that they make the fairest evaluation of you alongside your fellow applicants.  The applicant’s school needs to recommend them for the Scheme.
  • Cambridge Student Union runs GEEMA (Group to Encourage Ethnic Minority Applications) and the Target campaigns, both of which are encouraging under-represented groups to apply. Target gives state sector sixth forms the opportunity to have a talk from a Cambridge student about the application process.
  • The Cambridge University Access Initiative has the aim of widening participation, raising student’s aspirations and promoting Higher Education through visits, talks and teacher programmes.
  • The CUSU Shadowing Scheme gives students from schools without a history of Cambridge success the opportunity to shadow an undergraduate in their prospective subject. All accommodation and food is free, and travel often reimbursed depending on an assessment of need.
  • The Sutton Trust Summer School is the counterpart to Oxford’s UNIQ; these are free, subject-specific summer schools that take place over the summer, and give students a mini-Oxbridge environment to become more familiar with life at the university.
  • Experience Cambridge is a scheme for students who have unsuccessfully applied for  a place at the Sutton Trust Summer School, due to applying for an oversubscribed subject. This online course allows students to work on a three week, first-year level academic project designed by Cambridge Fellows.
  • Challenge Days are open to state-maintained school students in the UK in Year 10. These days give students an insight into studying at Cambridge, by providing mini-lectures in a chosen subject area, lunch at a Cambridge college, and a group debate.

Our Access and Scholarship Schemes

Each year, for students applying to Oxford or Cambridge Universities, we run a free Access and Scholarship Scheme. The Schemes provide personalised guidance over the course of a year, including one-to-one time with one of our best subject mentors and attendance on our intensive courses.

Read more about our Schemes here.

Empire-StateLast year, over 4,200 UK students chose US universities for their undergraduate studies. With over 4,500 universities to choose from, and a whole new vocabulary to learn, the admissions process can be daunting. With a basic understanding of a few of the terms and processes, however, and a good selection of reference materials, both students and advisors can overcome the challenges of navigating the US university admissions system.


Applications

US universities, like those in the UK, accept applications during the fall, September-January.  Also like the UK, many use a common application, helpfully named The Common Application.  All parts of the application are filed electronically, but schools may choose to send paper copies of letters of recommendation and exam results.  The student will need two letters of academic reference, and one main school reference discussing the student’s contributions to the school, both in and out of the classroom.  The student is asked to write one personal essay, but should be aware that many universities using the Common App require additional supplementary statements.  Students can link to their chosen universities through the Common App and find all admissions requirements through those links.  If a university is not listed on the Common App, the student will find the application on the university’s website.

Admissions Requirements

Most US universities require admissions tests. A student can choose between the SAT or the ACT, but should check with the university website to see if either is preferred.  In addition, the most selective of US universities often require the student to submit SAT Subject Test scores.  Most students sit for the SAT or ACT twice, so it is important to start the testing process early.  Students in their AS year should sit the exam in either January, May or June, with the idea of re-sitting it in their A Level year in October, November or December.  Registration is all online, and there is no late registration.  Students may register and get more information on sat.collegeboard.org/ and www.actstudent.org/regist/.  There are no minimum scores required for admission, but a university’s website will give you an idea of the range of scores they will consider.  The SAT/ACT score accounts for about half of what a university considers in evaluating applicants; the other half comes from the student’s academic record, activities and interests, and the school’s recommendation.  As admission is rarely subject-based, there are no course requirements for admissions, although applicants would be expected to have some academic background for specialist courses.

Choosing a university

American-StreetWith so many to choose from, it’s important that students start the process by thinking about what type of a university they want by considering location, size, academic offerings and cost.  The best place to begin is on The College Board’s Big Future website.  Here, the student will be able to research universities, majors and scholarships.  It really is a one-stop-shop!  Another great resource is The Fulbright Commission, a US-government funded organisation to promote US education around the world. Their website provides a wealth of helpful information.

Funding a US education

Make no mistake; it’s expensive to study at US universities. The vast majority are residential in nature, and a student has to consider not only the tuition and fees but the room and board.  Tuition and fees can vary significantly from university to university, as there are no standard government-set fees as in the UK.  Private universities are generally the most expensive, with state-funded universities often less so.  However, as private universities often have more financial aid available, the price for the student can sometime be even less than at a state institution. 

The best source of financial aid is always the university’s financial aid office.  Few give merit aid; most give need-based aid, but sometimes not to international students, so this should be researched early on.  In addition to Big Future, students can get information about aid and scholarships from Finaid-The Smart Student Guide to Financial Aid.

Timeline

Ideally, students interested in applying to the US will begin the testing process in the spring of their penultimate year in school, with re-sits in the autumn of their last year.  Application deadlines vary, but the majority fall in November-January.  Students will receive a response to their applications in mid-late March, with April 1 being the reply day for Ivy League universities.  Students have until May 1 to make their decisions, and must notify their university of choice that they will be attending by that date.  Students who are also applying to UK universities and waiting for exam results in August should accept their US offer, and then if they decide to take their UK choice, simply notify the US university to say that their plans have changed.

So, whether it is for the flexibility of academic programs at a wide range of academic institutions or the chance to experience American university life, or simply the desire to gain a more international view of the world, there are many good reasons for students to want to study in the US.  Granted, the process is more complicated than that of UCAS, but the rewards can be great, and between The College Board and The Fulbright Commission, there is a lot of help to guide you through it!

Eileen Penman is an American-born graduate of the University of San Diego. Chair of the Guidance Committee of the European Council of International Schools (1995-2006) and member of the TOEFL Board, the SAT Advisory Board, the Advanced Placement Advisory Board, she is an expert educational consultant and adviser. Here, she shares with us essential tips and guidelines for supporting students applying to the US. More on Eileen Penman…

Magazine button
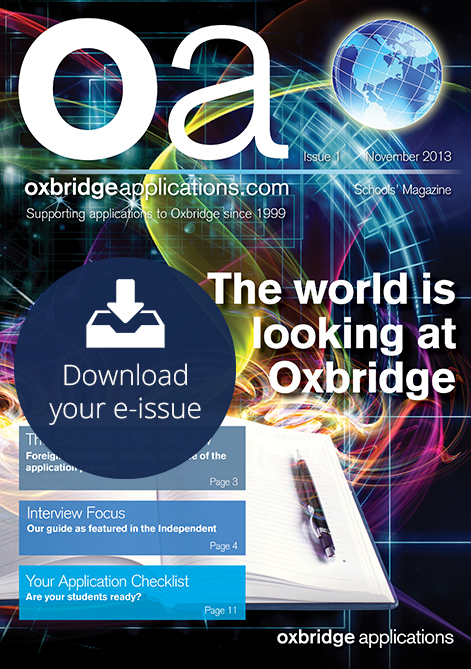
Last year, Oxbridge Applications launched its first ever Schools’ Magazine, packed full of university admissions news, resources and titbits for you and your students.

Our second issue will be released over the summer, ready for the September term and early admissions chaos. Until then, you can download the previous issue here.

For more Schools Materials, check out our Schools Pack


Download the magazine


Request a free schools pack


Our consultant and Premier Tutor Olivia writes in the Huffington Post, exploring the rise in international applications and how this is affecting applicants, as well how much of an impact a degree from Oxford or Cambridge still has worldwide.

UCAS stats released 2016

‘University Applications Soar’

Huffington Post Piece


 Where Next?


Oxbridge Applications Logo

Our Oxbridge-graduate consultants are available between 9.00 am – 5.00 pm from Monday to Friday, with additional evening availability when requested.

Oxbridge Applications, 58 Buckingham Gate, London, SW1E 6AJ


Added to cart

View Cart